Abstract: This study is concerned with the analysis of the behavior of anchorage zone in prestressed concrete girders with considering the effect of concrete strength by using nonlinear modelling. Nonlinear models for concrete and reinforced steels were used to simulate the behavior of local regions and general regions behind the anchor. Two considered cases include one anchorage head and two anchorage heads made by different concretes classes. The results provided an elementary data about stress, strain distribution, and crack pattern of anchorage regions under tendon force. The effect of the concrete strength and of the number of anchorage was also clarified.
Keywords: Anchorage, zone, concrete, crack, damage, structure, modelling.
- Introduction
Tendons in post-tensioned concrete structures typically provide a significant contribution to the ultimate strength and serviceability of the member or structure in which they are installed [1]. Design of cable anchorage zone in prestressed concrete girder bridges is different from overall design of bridge structures due to the complicated behavior of these ones subjected to a large amount of concentrated tendon force. According to AASHTO LRFD 5.10.9 [2], this zone is limited by a local region and a general region; the general region subjected to tensile stresses due to spreading of the tendon force; the compressive region just behind anchorage head called local one. These regions can be accomplished with 3D finite element modelling, shown a very complicated stress and strain fileds including vertical tensile stresses and the longitudinal compressive stresses; cracks appeared due to busting stress and spalling stress when tendon force reaches a critical value include tendon path crack, upper and lower diagonal crack [3], [4].
Traditional design methods for anchorage zone with elastic theories or strut-and-tie method based on plastic theories in bridge specifications do not allow for a good understanding of the mechanism of appearance and propagation of cracks that essentially bring about the failure of anchorage zone [5], [6].
A number of problems have occurred in post-tensioned applications in both the bridge and the building field which indicate that the design procedures and design criteria for post-tensioned anchorage zone tensile stresses need further examination and refinement [7]. The cracking which occurred in these anchorage regions was controlled by auxiliary reinforcement and the member strength was not appreciably [7]. Some nonlinear modelling were carried out for understanding the mechanisme of initiation and propagation of cracks in anchorage zones, with a typical concrete used using typical models for concrete based on damage, plasticity theory with considering the bonding between deformed reinforcement bars and concrete. A safety value of tendon force used in real structures was shown compared to the critical values obtained from numerical results.
This research contributes to the analysis of the behavior of concrete regions behind anchor plate of prestressed concrete girder bridges with considering different concrete classes.
2. Structural and material properties
Used anchors Type EC 5-12 are produced by VSL Company. Two considered cases here in: (i) action of 01 anchor (Fig.1.a), (ii) action of 02 anchors (Fig.1.b). For each considered case, the main parameter controlling the behavior of concrete after the anchor head is the tendon force which is expressed by allowable working stress of cable tendon, normally varying from 60% to 75% of critical stress of tendon (fy ≈ 1860 MPa) [2]. In this study, the maximal value of tendon force N = 3535kN; tendon force has been divided into 100 steps increasing from zero to N during the modelling process.
(a) 01 anchorage head
(b) 02 anchorage heads.
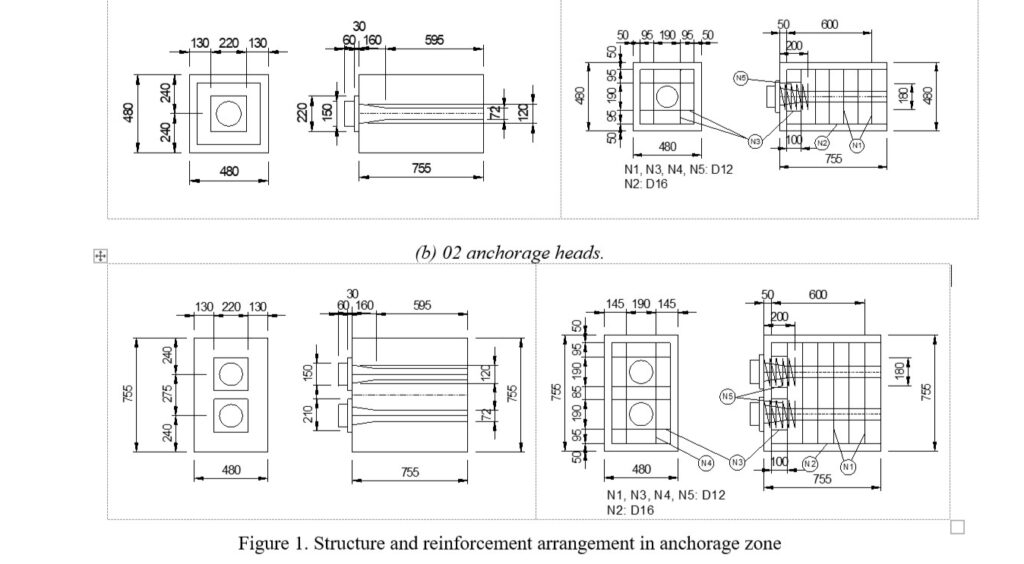
Figure 1. Structure and reinforcement arrangement in anchorage zone
The analysis was performed with 6 different types of concrete to consider the effect of concrete strength on the behavior of anchorage zone. The material properties of concrete classes and steel reinforcements are shown in the following tables [8],[9]:
Table 1: Steel reinforcement properties
| Type | Diameter (mm) | Young modulus (Mpa) | Unit weight (N/mm3) | Poisson coefficient |
| D12 | 12 | 210000 | 0.000785 | 0.15 |
| D16 | 16 | 210000 | 0.000785 | 0.15 |
Table 2: Six concrete classes’ properties
| Materials | Steel | M20 | M25 | M30 | M35 | M40 | M50 | |
| Unit weight g (N/mm3) | 7.85×10⁻⁴ | 2.5×10⁻⁵ | 2.5×10⁻⁵ | 2.5×10⁻⁵ | 2.5×10⁻⁵ | 2.5×10⁻⁵ | 2.5×10⁻⁵ | |
| Young modulus E (Mpa) | 210000 | 23151.51 | 26422.82 | 28720.87 | 30869.63 | 32656.22 | 35864.69 | |
| Comp. resistance f’c (N/mm2) | x | 20.26 | 26.39 | 31.18 | 36.02 | 40.31 | 48.62 | |
| Tensile strength ft (N/mm2) | x | 2.91 | 3.55 | 4.01 | 4.18 | 4.37 | 4.54 | |
| Fracture energy Gf (N/mm) | x | 0.201 | 0.298 | 0.303 | 0.317 | 0.345 | 0.354 | |
| Poisson coefficient ν | 0.15 | 0.2 | 0.2 | 0.2 | 0.2 | 0.2 | 0.2 | |
| Crack band width h (mm) | x | 549.527 | 624.797 | 541.192 | 560.065 | 589.959 | 615.969 | |
| Constitutive Models | Comp. | Elastic | Hordijk | Hordijk | Hordijk | Hordijk | Hordijk | Hordijk |
| Tension | Elastic | Thorenfeldt | Thorenfeldt | Thorenfeldt | Thorenfeldt | Thorenfeldt | Thorenfeldt |
3. Finite element modeling
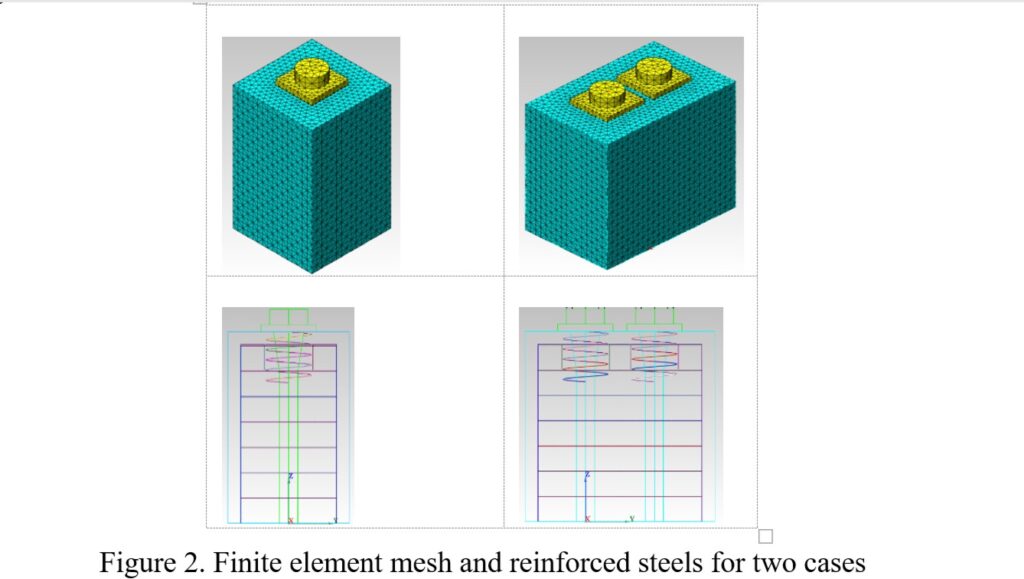
Smeared 3D crack model is considered to simulate in these examples. Anchorage zone model consists of concrete, reinforcing steel, and anchor plates [10]. 34282 solid elements with10-node tetrahedron and 974 beam elements are in turn applied for the finite element meshes of one-anchor problem and two-anchor problem. Finite element meshes are constructed so as to be fine in unfavorable zones and sparse in elastic zones to reduce calculation time. Nonlinear models was assigned for all concrete elementsbased on Hordijk and Thorenfeldt models implemented in Midas FEA [9]; linear elastic model was assigned for steel reinforcements. The simulation process was carried out with controlling of load.
4. Result and discussions
Behavior of anchorage zone under the action of tendon force can be divided into two phases: concrete linear-elastic (phase I), nonlinear concrete behavior and cracks formed (phase II).
4.1. Stiffness of anchorage zone
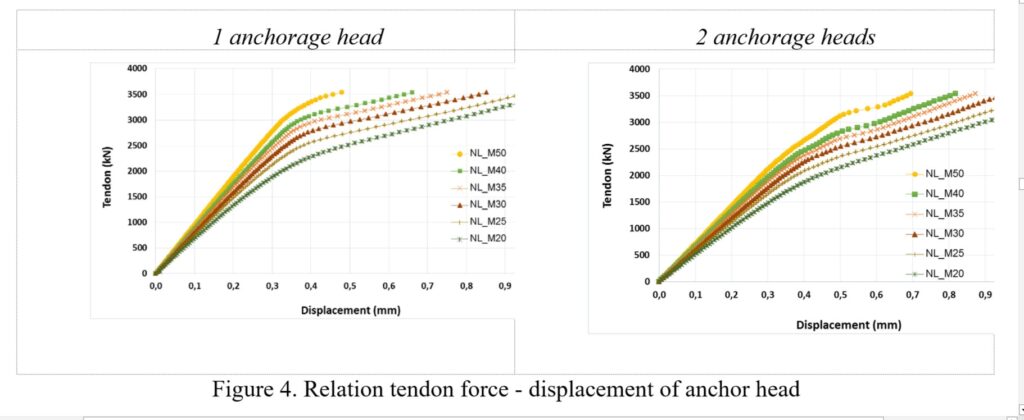
Based on the analysis result, it can be seen that the stiffness characteristic increases proportionally with the increase of concrete strength, this is due to higher concrete grade presents better mechanical properties.
Refer to Figure 3 and Figure 4, it is clear that the higher the concrete strength, the higher the limitation of the linear – elastic range, this lead to the better behavior of the anchorage zone. Concrete M50 can resist pre-tensioning force up to 2700 kN (≈ 77% maximum tendon force) and still behave linear – elastic while with this force, the concrete M20 works out of elastic range and the strain is so large.

4.2. Stress Distribution in Anchorage zone
Stress results obtained from the FEM are presented and discussed in this section. These analyses were performed in order to determine the effect of the corresponding strength of concrete on the behavior of anchorage zone. In small load step (from load step 1 to load step 68 with one-anchorage, and 1 to 58 with two-anchorage) the stress and strain distribution is in linear-elastic range. From step 69 and 59 upwards, stress and strain distribution is outside of elastic range. Figure 5 illustrates stress and strain distribution which is equal to von Mises in nonlinear-elastic analysis at load step 100. Table 3 also details
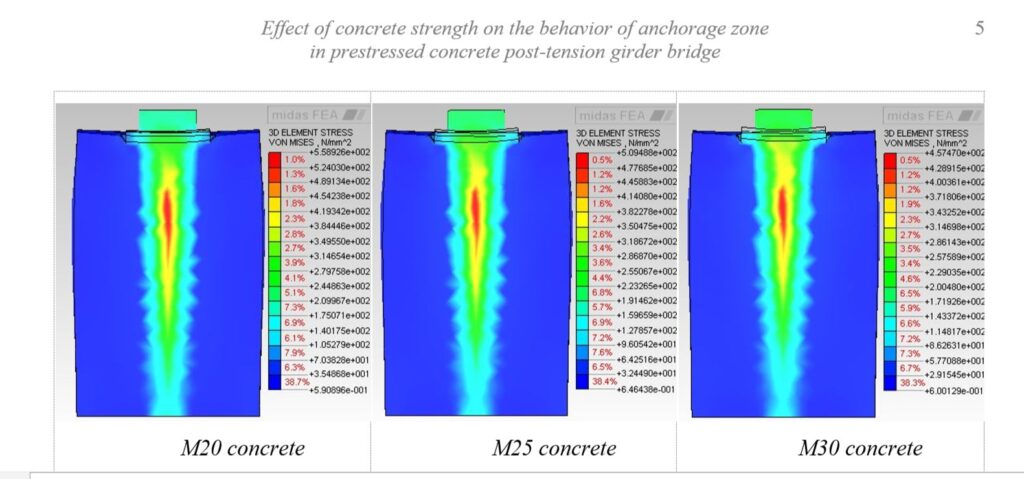
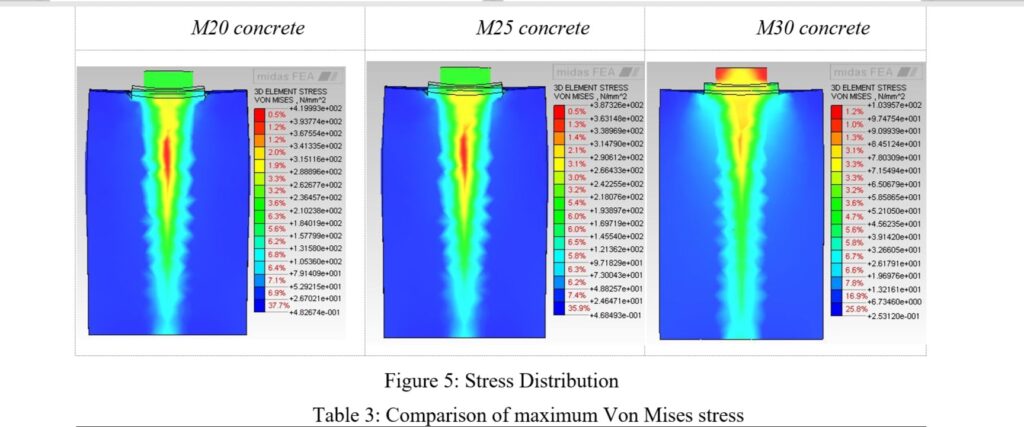
Table 3: Comparison of maximum Von Mises stress
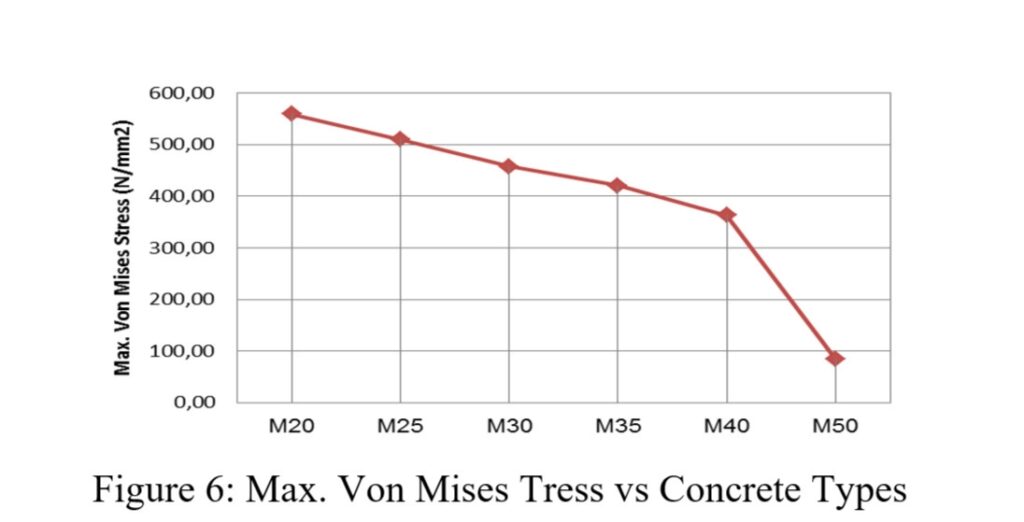
| Model No. | Concrete Type | Max. Von Mises Stress (N/mm2) | Model No. | Concrete Type | Max. Von Mises Stress (N/mm2) |
| 1 | M20 | 5.59×10² | 4 | M35 | 4.20×10² |
| 2 | M25 | 5.09×10² | 5 | M40 | 3.63×10² |
| 3 | M30 | 4.57×10² | 6 | M50 | 8.45×101 |
Maximum Von Mises stress versus concrete types were plotted and are shown in Figure 6, as expected, the curve shows that stresses decreased with the increase of concrete strength. From the curve, it can be seen that the greatest stress reduction occurred when M50 concrete is used for anchorage zone. It can also be seen that the concrete type below M35 causes the stress much higher in anchorage zone as compared to the concrete M40 and M50. Based on the comparison in Figure 6, it was reasoned that by using concrete above M40 type, the stress in anchorage zone could be decreased.
4.3. Crack in anchorage zone
We consider crack status of specimens in Figure 7. It is observed that failure of specimens with multiple cracking and diagonal cracking.

The first crack appears at behind the local compressed zone. The number of cracks increases gradually at this point corresponding with the increase of loading steps. The cracks spread out to the bursting stress area and then appear on the outer surface of the concrete.
At the final loading steps, the significant development in cracking results in the great drop of the stiffness in some points. At this time, iteration is not converge and the structure is considered incapable of bearing.
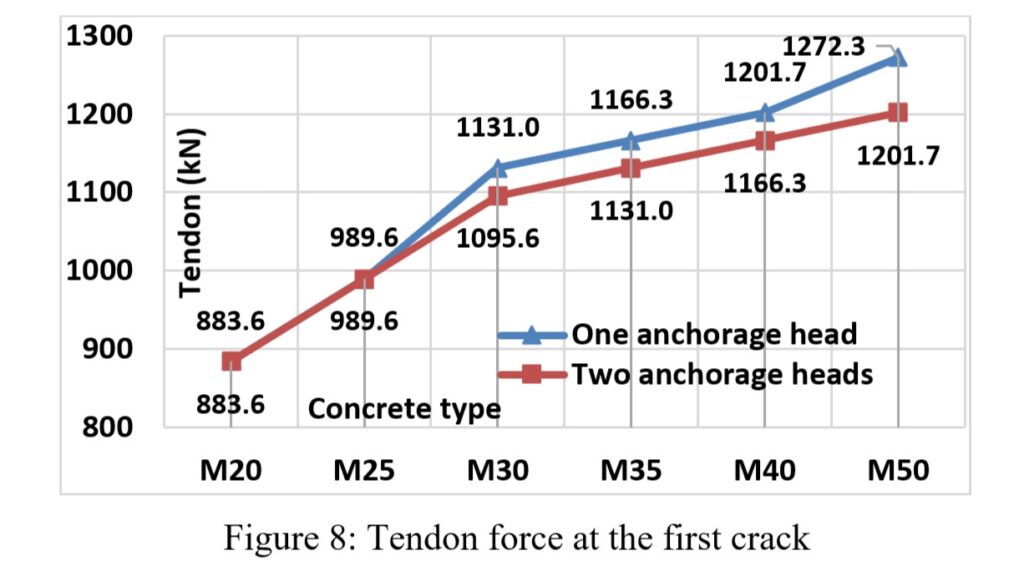
It is evident from the Figure 8 that the crack appears later and at higher tendon force in the anchorage zone made from higher concrete grade in comparison with the anchorage zone made from lower concrete grade. The first crack of M50 concrete appears when tendon force reaches 1272.3 kN while in concrete M20 the crack appear at tendon force of 883.6 kN, which is 1.4 times smaller.
Observations of concrete cracked indications through the maximum principal strain parameters from Figure 9 showed that cracking occurs around the anchor plate and along the tendon profile.


A decrease in the intensity of cracking in an increase of concrete grade can be seen in Figure 9. The crack intensity of lower concrete grade appears over a wider range (along tendon profile and around anchorage plate) while smaller range is shown in higher grade of concrete. In concrete M50, crack appears mainly around anchorage plate and small number of crack appears along tendon profile, however, the difference can be seen in concrete M20, a large number of crack occurs around anchorage plate and extent around tendon profile (around the bursting area)
5. Conclusions
The results of this research have proved that with the higher of concrete grade, the behavior of the anchorage zone (toward crack, stress and strain) is better. Anchorage zone of high strength concrete can work in linear – elastic range with larger tendon force compared to anchorage zone of low concrete strength.
The damaged cracks appeared even in low loading steps. The first cracks were on concrete area behind anchorage zone and around the tube (local area). This could be explained as follows: the concrete area which experiences the strong horizontal expansion makes “around” stress rise in neighboring concrete area when it is under strong vertical press. In regards of stream load, if the concrete is not controlled well the stream load becomes more expanded, and thus, effect of round stresses is greater. These round stresses are the reasons causing cracks at local compressed zones.
For anchor types commonly used for the design of usual bridges in Vietnam produced by companies like HVM, VSL or Freyssinet …, the maximal allowable tendon forces varies normally from 1200 kN to 1700 kN. This interval is so moderate when we compare it with critical values of tendon forces obtained from this numerical simulation. Concrete should be better than M40 type. With concrete M50 we can hence conclude that the measure of security for tendon forces in reality is fairly considerable.
References
[1]. Cervenka V., Ganz H. G., “Validation of post-tensioning anchorage zones by laboratory testing and numerical simulation”, Structural Concrete 15, No. 2, 2014. [2]. AASHTO LRFD Bridge Design Specifications. American Association of State Highway and Transportation Officials, Washington, D.C, 1994. [3]. Jo B. W., Byun Y. J., Tae G. H., “Structural behavior of cable anchorage zones in prestressed concrete cable-stayed bridge”, Canadian Journal of Civil Engineering. Vol. 29. 2002. [4]. Nie J.G., Zhou M., Wang Y. H., Fan J. S., Tao M. X., “Cable Anchorage System Modeling Methods for Self-Anchored Suspension Bridges with Steel Box Girders”, Journal of Bridge Engineering, Vol. 19, No. 2, 2014. [5]. E G. Nawy, P. E. Reinforced concrete: A Fundamental Approach, Prentice – Hall, Inc, 2000. [6]. Fenwick. R. C., Lee S. C., “Anchorage zones in prestressed concrete members”, Magazine of Concrete Research, 38(135): 55–60. ©NRC Canada. 2002. [7]. Stone W.C., Breen J. E., “Behavior of Post-Tensioned Girder Anchorage Zones”, PCI Journal, Vol. 29, No. 1, Chicago, pp. 64–109, 1984. [8]. Truyen T. Tran., “Contribution to the study of mechanical and hydro-mechanical behaviors of concrete”, PhD Thesis (in French), University of Liege. 2009. [9]. MIDAS IT, Midas FEA Analysis and Algorithm. 2015. [10]. Setiawana A. F., Sulistyob D., and Aminullahc A., “Finite Element Method for Numerical Analysis of Post-Tension Anchorage Zone”, 2nd International Conference on Sustainable Civil Engineering Structures and Construction Materials 2014 (SCESCM 2014). 2014.